A New Era of No-Code Data Intelligence
In today’s data-driven world, organizations large and small rely on insights hidden inside spreadsheets and databases. Yet, traditional business intelligence (BI) tools often require programming knowledge, database skills, and steep learning curves. EasyAIBridge reimagines this process by eliminating the technical barrier — allowing anyone, from startup founders to analysts and managers, to interact with their data in plain English.
EasyAIBridge is a no-code, no-SQL data analysis, reporting, and visualization platform that runs directly in the browser. It empowers users to connect data sources, type natural language questions, and instantly receive fully-formed analytical reports — complete with charts, tables, and narrative summaries. With just a few clicks, you can transform raw numbers into eloquent stories that help you make crystal-clear decisions.
Bridging Simplicity and Power
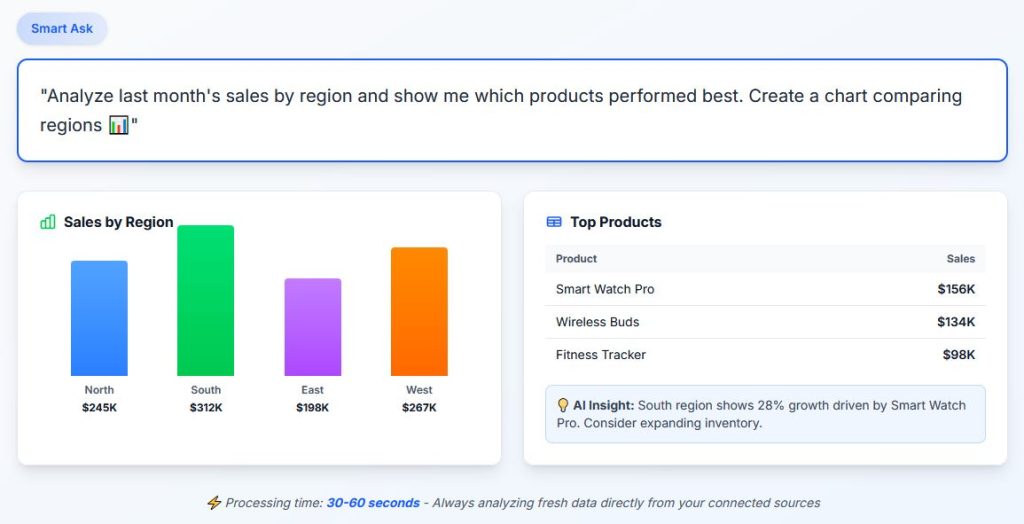
At its core, EasyAIBridge connects seamlessly with Google Sheets, and allows Excel and CSV files to be uploaded and automatically converted into Google Sheets datasets. Once uploaded, users can simply ask questions such as “Show me monthly sales growth by region” or “Compare marketing spend versus conversion rate,” and within seconds, the platform returns a comprehensive visual report.
Each request triggers a powerful multi-model AI workflow under the hood:
- A strategist model interprets your intent and translates your query into SQL-style computation logic.
- A computation engine processes that logic with remarkable efficiency.
- A storytelling model converts the results into user-friendly charts, tables, and text-based insights.
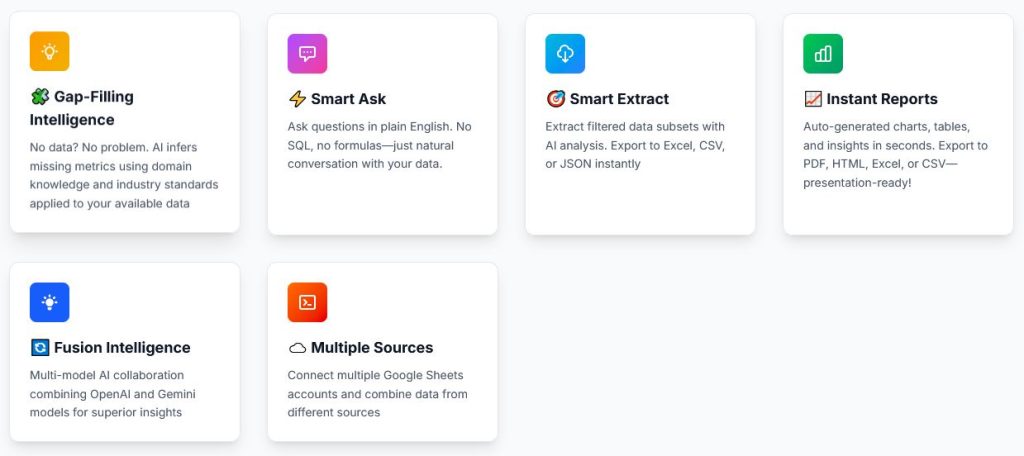
This “fusion intelligence” makes EasyAIBridge much more than a chatbot over data — it’s a full analytical ecosystem capable of producing dashboards and narratives dynamically. Users can combine multiple Google Sheets or accounts, perform cross-data analyses, and rerun saved analyses on updated datasets to stay up to date effortlessly.
Technology That Speaks Efficiency
Unlike many analytics competitors that depend on Python or R-based computational back-ends, EasyAIBridge is built on a web-native Node + SQL engine. This makes it fast, lightweight, and highly scalable. Because it operates entirely in the browser, there’s no local computation required — meaning you can use it anywhere, on any device, without installations or complex configurations.
This architecture keeps operational costs low and performance high, even when working with tens of thousands of data rows. The real-time responsiveness is especially impressive for a SaaS product, offering users instant feedback as they explore their datasets.
How to Use EasyAIBridge
To get started, visit EasyAIBridge.com and sign up for a free trial account — no credit card required. Once logged in, connect your Google Sheets or upload an Excel/CSV file. The platform will automatically manage data ingestion and conversion.
From there, you’ll see a simple input box inviting you to type your question. You might start with:
“Show me the top-performing products in the last quarter.”
EasyAIBridge then performs the data computation in real time and generates a comprehensive visual report. The interface displays interactive charts, tables, and explanatory narratives side by side, offering an experience that feels more like a dialogue than a query execution.
You can save analyses, schedule recurring reports, and even export visualizations for presentations or documentation. A data processing report also appears transparently, showing how your input was interpreted and what data sources were used — reinforcing trust and accountability.
Where It Stands in the Market
While tools like Julius and ExcelMatic offer conversational analytics, they primarily provide one-shot answers to individual questions. EasyAIBridge stands apart by generating complete analytical reports, integrating visuals, text, and computation seamlessly. Its use of Node and SQL, rather than Python or R, makes it faster and more resource-efficient — an industry-leading approach that proves you don’t need a massive back-end to achieve enterprise-grade analysis.
It’s also ideal for tech-savvy users who are eager to learn the ropes of data science concepts without coding, and for teams seeking to thrive on real-time intelligence. In a sense, EasyAIBridge acts as your AI data scientist on demand — always ready to analyze, visualize, and narrate insights in seconds.
The Big Picture
As the SaaS ecosystem grows, tools like EasyAIBridge highlight a broader shift toward democratized analytics — where business users no longer need to rely on IT teams or data specialists for every report. It opens a new window of opportunity for startups, educators, and decision-makers to explore their data intuitively and much more efficiently, stretch their analytical horizons, and give AI-powered data analysis a whirl before investing in enterprise software.
For those with a burning desire to simplify reporting without compromising depth, EasyAIBridge delivers a refreshing balance of intelligence, speed, and accessibility. Put in the effort to explore it, let the experience sink in, and you’ll quickly realize that when it comes to AI-driven data storytelling — the sky’s the limit.